Power BI streaming data sets: The good, the great, and the gotchas
By the Blueprint Team
In mid-2017, Microsoft added a very interesting feature to Power BI, namely support for streaming data sources.
In this article we will dive into some of the streaming data coolness as well as some Gotchas involved when using these kinds of data sources in Power BI. In particular, we will…
- Clarify some poorly documented definitions with respect to streaming data source types
- Demonstrate how to configure streaming data sources in Power BI Online
- Provide code for the “MegaGameCo Real-time KPI Aggregator” as an Azure Function in C# script
- Show how to make use of Power BI’s own backing data store for streaming data sets. Create a simple report and a dashboard from the same streaming data set.
Preliminaries
Although streaming data sources in Power BI have been around for almost a year, there is a fair amount of confusion about their various flavors. Curiously, Microsoft started throwing around some data set names without explicitly defining them anywhere, so let’s clear that up first:
Streaming Dataset: As the name implies, streaming datasets have limited or no history and just look at the most current values for each field. Because there is no history, there are only a few special purpose tiles for showing streaming data in dashboards. The upside of using these is that they update on change, meaning that if your data changes every second, so will the tiles. There are situations where this is critical, so this is a very nice feature to have available in Power BI if you need it.
Push Dataset: This is a special case of the streaming dataset in which you enable Historic data analysis in the Streaming data source configuration dialog:

Figure 1 – Enabling Historic data analysis in streaming dataset configuration
Push datasets are stored in Power BI online and can accept data via the Power BI REST API or Azure Streaming Analytics. One of the most interesting things about Push datasets is that, in spite of providing 5 million rows of history by default, they do not require a database. We can, in fact, push streaming directly from a source such as a device or executing code to Power BI Online’s REST API.
Because there is a backing data store, namely Power BI Online itself, you can also wire up normal report widgets and look at trends, history, etc.
PubNub Datasets: PubNub is third-party data service (http://pubnub.com). It is designed with IoT in mind, but its powerful backend data stores can provide data for chat platforms, log readers, and more. It is also free for up to 500 devices (each of which is essentially a data source).
For the record, here are the capabilities of each type of data set:
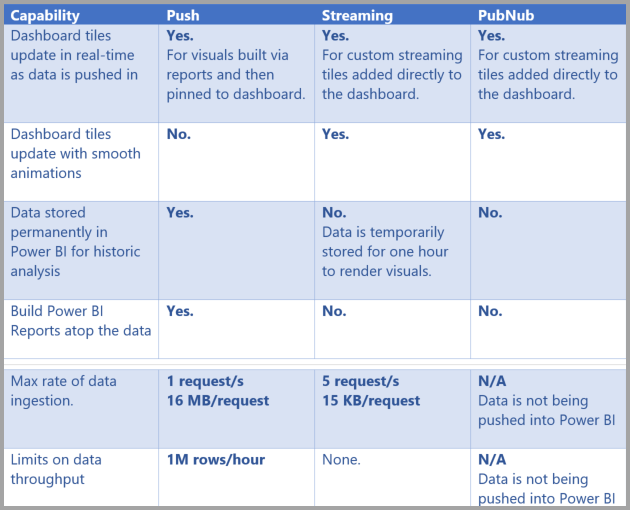
Figure 2 – Capabilities of each type of streaming data set
(from https://docs.microsoft.com/en-us/power-bi/service-real-time-streaming)
For more information from Microsoft about streaming data sources, start here:
https://docs.microsoft.com/en-us/power-bi/service-real-time-streaming
For more Power BI REST API limits, look here:
https://docs.microsoft.com/en-us/power-bi/developer/api-rest-api-limitations
Our Use Case
In many cases, being able to wire-up a data source directly to Power BI–with no database and/or REST API development required–provides an astonishing bang for the buck. For example, imagine that you have an Azure Function that calculates several key performance indicators for your company once a minute. You can then stream that data directly to Power BI and set up both a report and a dashboard that uses that data.
That is, in fact, exactly what we are going to develop right now: We are going to pretend that we are online game company moguls and want to make sure there are no glitches in our money machine in real-time. Like Scrooge McDuck, we get great comfort watching our money pile grow.
MegaGameCo: I’ve Always Wanted to be a Mogul
Right out of the gate we face a conundrum: Do we create the data source in Power BI first or write our Azure Function? In the case of streaming data sets, it actually makes sense to configure the data source in Power BI first. You’ll see why in just a bit.
First, log in to Power BI Online and choose Streaming dataset from the Create menu:

Figure 3 – Creating a Streaming dataset in Power BI Online
Next, select API for the streaming dataset type.
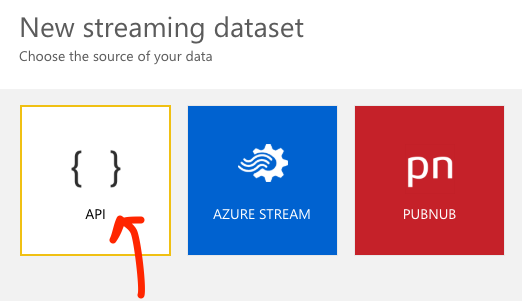
Figure 4- Selecting the streaming dataset type
You’ll see the New streaming dataset configuration dialog next (cf. Figure 5 below). This is where we can begin to see why we wanted to start with defining the dataset in Power BI Online instead of writing code first. Having defined the streaming data set, we can to see that,
- We have to place our values in a flat JSON data structure; no nesting allowed (cf. the sample at the bottom).
- We have to be very careful with spelling and capitalization in the value names: They must match our code exactly, both in name and type.
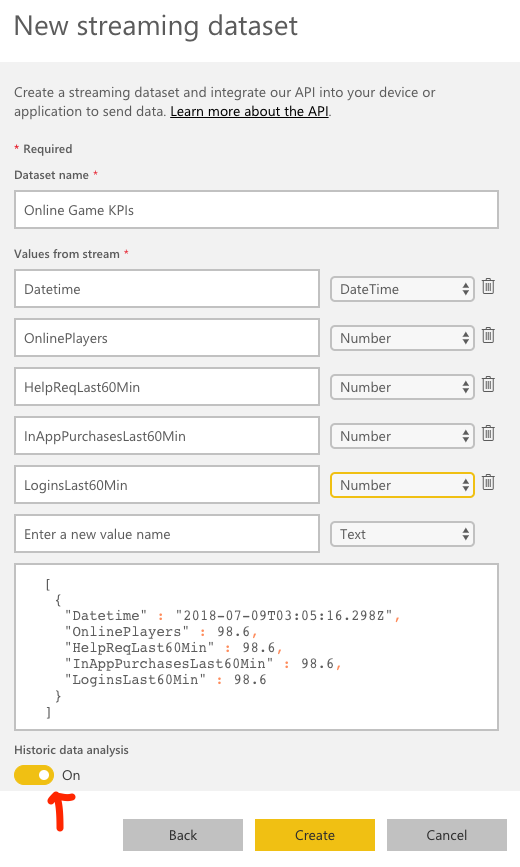
Figure 5 – The New streaming dataset configuration dialog
Note that we set Historic data analysis to On.
Honestly, I have not found a good reason to leave it off. The off state means there is no history so you can only show instantaneous values. Although that is sometimes all you need, as we will see you can still do that with it set to On as well.
Whether you use On or Off, you can change it at any time, so it is not a major issue.
Select Create. You’ll then get a look at the Push URL, shown below in Figure 6. Copy the URL and put it somewhere handy; we’ll be using it again shortly.
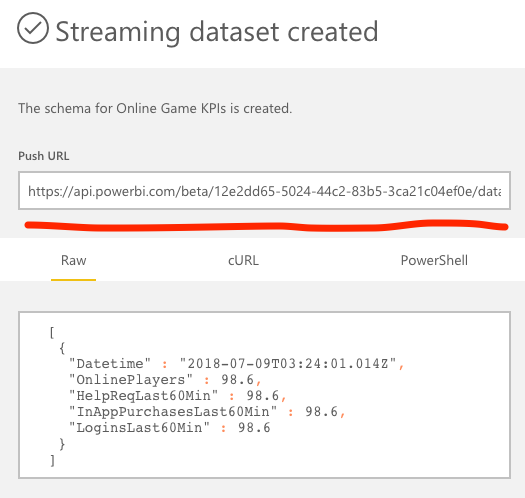
Figure 6 – The Push URL for the streaming dataset
That’s it for setting up the streaming data source. The Power BI Online infrastructure is now all primed and ready to start receiving our data stream—we just need to start sending it.
Serverless on the Server
Azure Functions happen to be a very low-overhead way to accomplish a lot of integration and/or aggregation tasks. In our MegaGameCo Real-time KPI Aggregator example, our integration is mostly imaginary in the sense that we are simply going to randomly generate some “metrics” that a typical online gaming company might be interested in. If you studied the data set configuration dialog in Figure 5, you already know that we are interested in how many players are currently online, how many new logins occurred in the last hour, how many in-app purchases occurred in the last hour, and how many help requests were made in the last hour.
Since the mechanics of creating an Azure Function are well-documented elsewhere (e.g. here: https://docs.microsoft.com/en-us/azure/azure-functions/functions-create-first-azure-function), let’s skip ahead to the parts that are specific to our KPI Simulator.
First, make sure you create a C# Timer trigger when you configure your function:
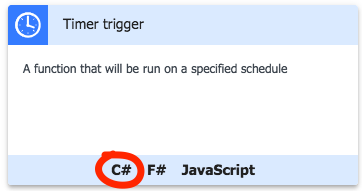
Figure 7 – A Timer trigger Azure Function selection
You can set whatever period you want for the timer, but my recommendation is once per minute. This will give us a decent amount of data to work with in short order.
Next, remember the Push URL I told you to save for later? Later is here now. Go into your new Azure Function’s Application Settings and create a key named “powerBiApiUrl”. The value of that key should be the Push URL, as shown below:
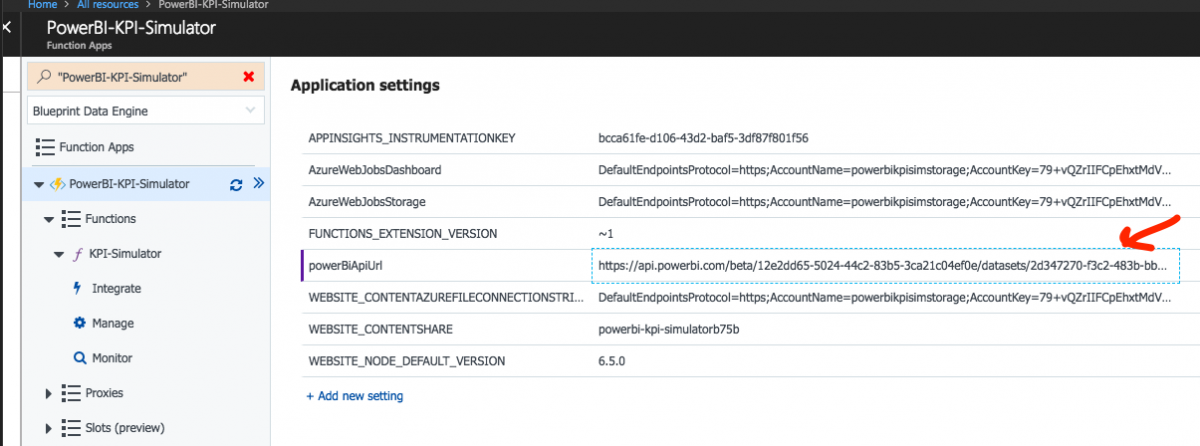
Figure 8 – Configuring the Push URL for the streaming dataset as an Application setting
Finally, you’re going to want to add some code that creates some data and POSTs it to the Push URL. You can use PostMan or some other REST client and POST your data row by row, one at a time, but our goal is to create a more realistic scenario with a fairly significant volume of data—running 24×7.
One of the easiest ways to do this is to use C# script. Our demo script in Listing 1 (appended to the end of the article) has no additional dependencies—you should be able to paste in the source code, enable the Azure Function and bingo, you’re off to the races.
There is one bit of the C# source that bears some explanation. If you think back to the data set configuration dialog where Power BI showed us a sample data set, you’ll notice something interesting… the data is in a JSON array:
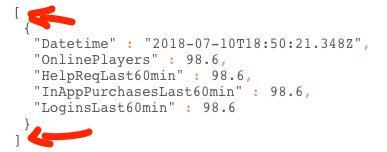
Figure 9 – JSON Array data
That is why the C# snippet below (taken from our Azure Function code) creates a KPI class instance and then sticks it into an array:
// populate new KPI object instance
var kpi = new KPI (onlinePlayerCnt, helpReqCnt, inAppPurchasesCnt, loginsCount);
KPI[] kpiArray = new[] {kpi};
var task = PostSimData(powerBiApiUrl, kpiArray, log);
The array causes JSON deserialization to add the leading and trailing brackets automatically… which is exactly what the Power BI REST API is expecting.
All of this implies you can send a batch of data to Power BI, which is, in fact, true… just another factoid to keep in your pocket for that rainy day when you need to increase throughput.
Now that we have it, what do we do with it?
So far, we have defined a streaming data source in Power BI, created an Azure Function that generates simulated KPI data and POSTs it to the Power BI REST API, the URL for which is read from the Application Settings. We should have a nice amount of data flowing into our Power BI API data store after just a few minutes, so let’s check it and see.
Let’s start by creating a simple report in Power BI Online. Select Report from the Create menu:
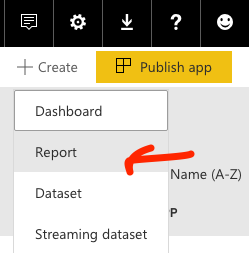
Figure 10 – Creating a new Report in Power BI Online
Next, select our streaming data set, Online Game KPIs, as the data source for the report:
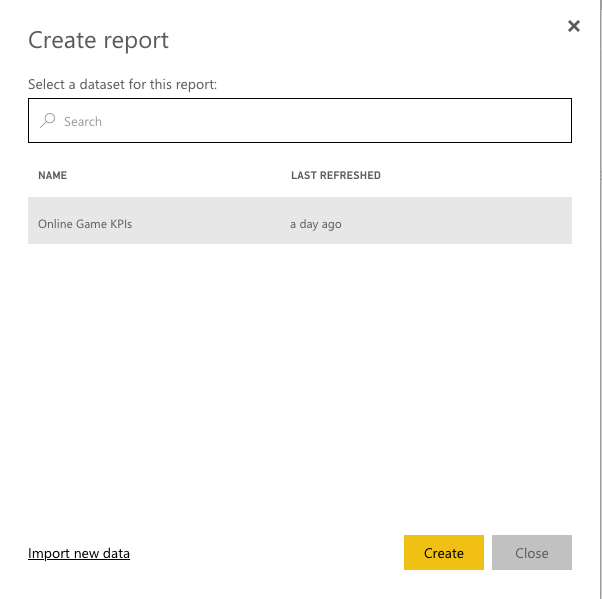
Figure 11 – Configuring our Online Game KPIs data set as the data source for a new report
Now place a new Table into the blank report and add the fields, starting with Datetime:
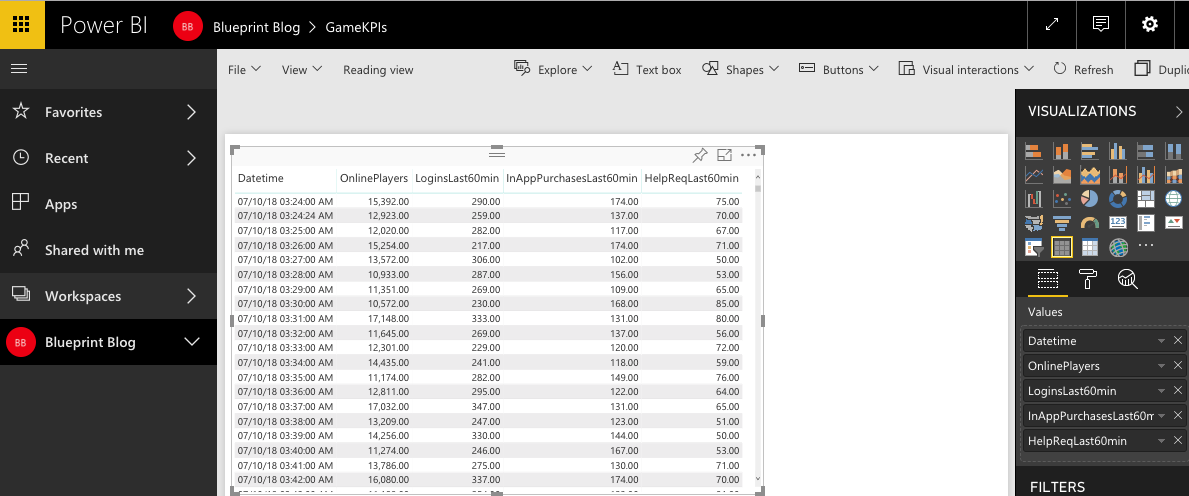
Figure 12 – Configuring a table based on our streaming data set
Right away you should note that there are hundreds of rows—proving that even without a database, Power BI Online is storing data for us.
Totally. Hands. (And database.) Free.
Save your report and now let’s create a dashboard. Select Dashboard from the Create menu.
Next, select the Add tile item from the toolbar (Figure 13), followed by selecting the Custom Streaming Data option in the next page (Figure 14):

Figure 13 – The Add tile toolbar item
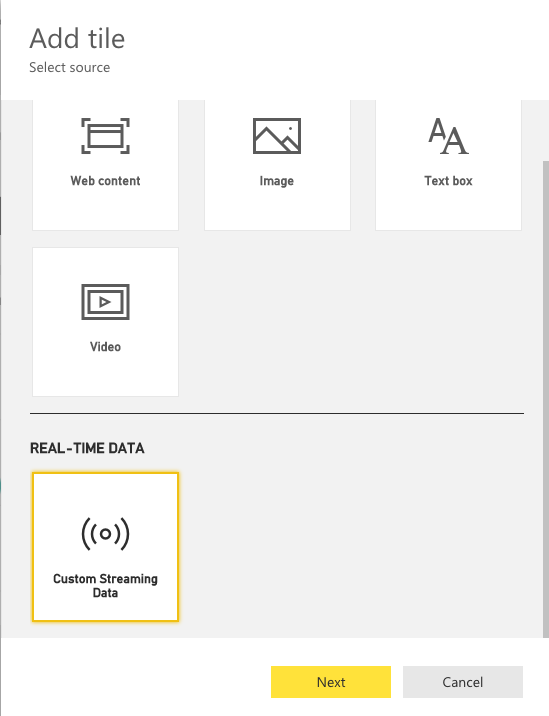
Figure 14 – Selecting the Custom Streaming Data source for a tile
Select the Next button and then link the new tile to our Online Game KPIs dataset:
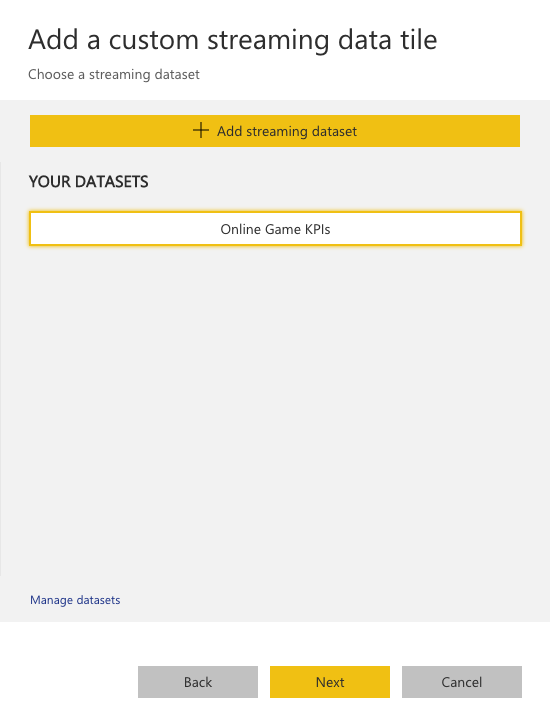
Figure 15 – Selecting the Online Game KPIs dataset
Next we get to decide what kind of tile to create.
We are going to eventually create a Card tile to display the current value for every data point and then afterwards create two line graphs to show the OnlinePlayers and LoginsLast60Min trends for the last hour. For the first tile, then, select Card as the type and OnlinePlayers field as the source of the value to show in the card.
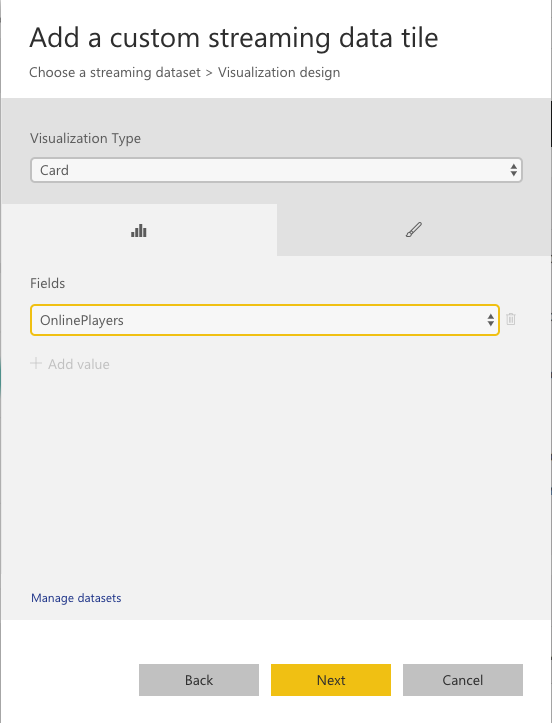
Figure 16 – Setting the tile type
Before selecting the Next button, select the paintbrush (formatting) tab in the dialog and set the Display units to None and the Value decimal places to zero. Other than the datetime of the stream data, all fields are integer and we want them displayed with no additional formatting.
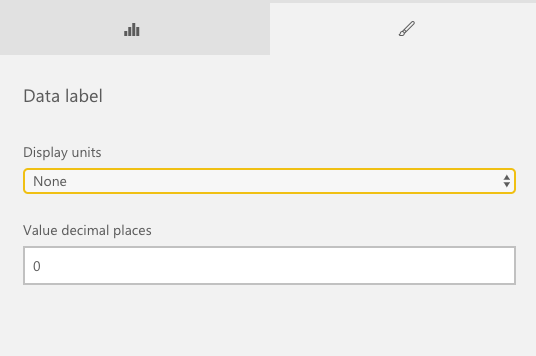
Figure 17 – Setting the format for the tile
Select Next, and then you can provide the title and optional subtitle for the tile. These are usually more human-friendly names for the data point; I turned field name “OnlinePlayers” to “Players Online” with a subtitle of “CURRENT”.
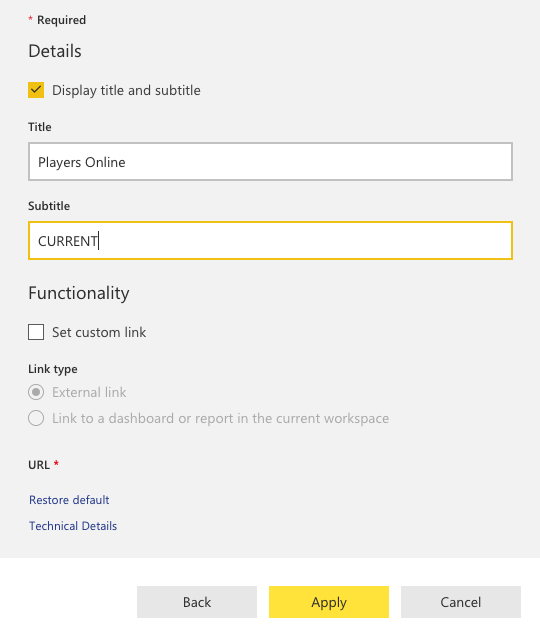
Figure 18 – Setting the title and subtitle for a tile
Once you select Apply, you should see a tile that looks something like this:
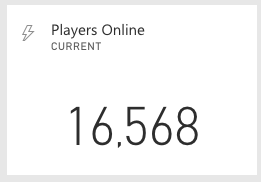
As mentioned previously, the goal is to create one tile for every data point. Go ahead and create the tiles for the other fields and format them the same way we did with the OnlinePlayers tile above.
I also mentioned that we want to create two line graphs to show the trends for OnlinePlayers and LoginsLast60Min. The steps are the same, except instead of choosing Card from the Visualization Type menu, choose Line chart. You also then choose Datetime for the axis (i.e, the X or horizontal axis) and OnlinePlayers for the values.
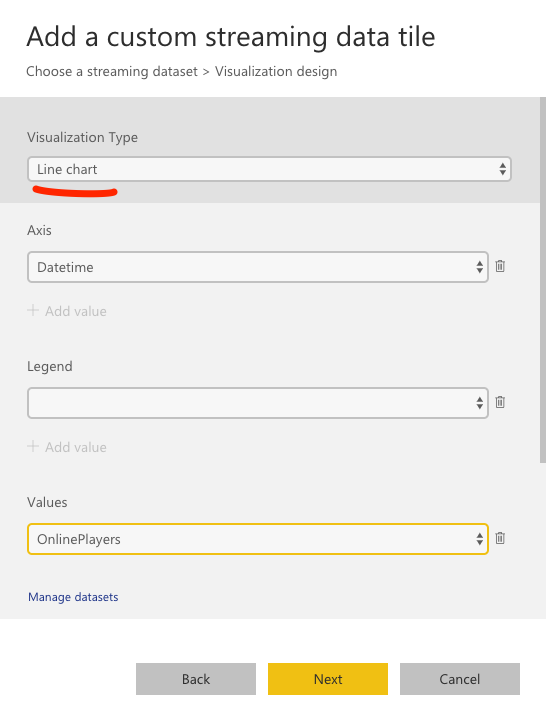
Figure 19 – Creating a line chart on a tile
Our plan was to also create a line chart for the LoginsLast60Min value, and that is left as the proverbial “exercise for the reader.” Just repeat the steps above and choose LoginLast60Min as the field to populate the Values.
In the end, you should have a dashboard suitable for framing… well, if not, then it is at least a near real-time dashboard that would make Scrooge McDuck proud:
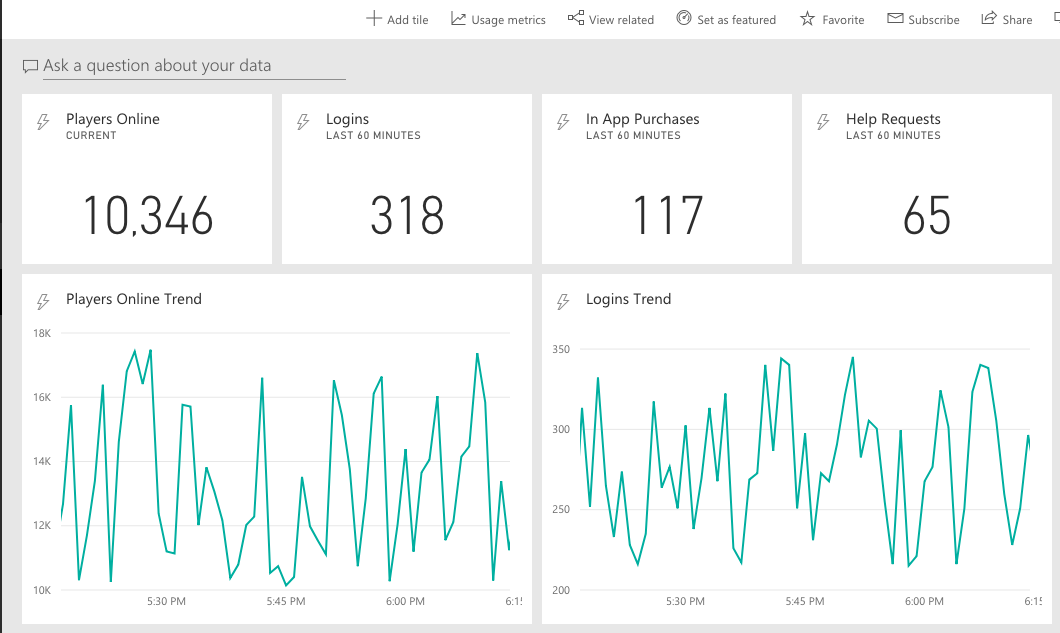
Figure 20 – The MegaGameCo Real-time KPI Aggregator Dashboard
There will rarely be any real trends in the two line graphs since our code generates random data for each data point within a given range (cf. Listing 1). Nevertheless, it is nice to watch the line charts update right along with the instantaneous value cards in the top row.
Streaming data sets provide some very valuable tools for the display of near real-time information. By enabling historical data so that the data is stored into Power BI Online, you can get the best of both worlds, namely real-time instantaneous values combined with historical trends.
I hope you enjoyed this tutorial. Happy streaming!
Listing 1 – The KPI Simulator Azure Function code (C# Script)
/*
--------------------------------
KPI Simulator
by Ross W. Lambert
Blueprint Technologies
Copyright (c) 2018
All Rights Reserved
--------------------------------
*/
#r "Newtonsoft.Json"
using System;
using System.Collections;
using System.Net;
using System.Net.Http;
using Newtonsoft.Json;
// some constants for our simulated data
private static readonly double MAX_VARIANCE_PCT = 0.75;
private static readonly String NAME = "KPI-Simulator";
private static readonly String APICONFIG = "powerBiApiUrl";
private static readonly int MIN_PLAYERS = 10000;
private static readonly int MAX_PLAYERS = MIN_PLAYERS + (int) (MIN_PLAYERS * MAX_VARIANCE_PCT);
private static readonly int MIN_PURHCASES = 100;
private static readonly int MAX_PURHCASES = MIN_PURHCASES + (int) (MIN_PURHCASES * MAX_VARIANCE_PCT);
private static readonly int MIN_HELPREQ = 50;
private static readonly int MAX_HELPREQ = MIN_HELPREQ + (int) (MIN_HELPREQ * MAX_VARIANCE_PCT);
private static readonly int MIN_LOGINS = 200;
private static readonly int MAX_LOGINS = MIN_LOGINS + (int) (MIN_LOGINS * MAX_VARIANCE_PCT);
// share a client so as to not exhaust resources
private static readonly HttpClient client = new HttpClient();
// one random number generator to rule them all
private static readonly Random randomGenerator = new Random();
// little private class to hold our KPIs
private class KPI
{
    // properties
    public DateTime Datetime { get; set; }
    public int OnlinePlayers { get; set; }
    public int HelpReqLast60Min { get; set; }
    public int InAppPurchasesLast60Min { get; set; }
    public int LoginsLast60Min { get; set; }

    // full constructor
    public KPI(int onlinePlayerCnt, int helpReqCnt, int inAppPurchasesCnt, int loginsCount)
    {
        this.Datetime = DateTime.Now;
        this.OnlinePlayers = onlinePlayerCnt;
        this.HelpReqLast60min = helpReqCnt;
        this.InAppPurchasesLast60min = inAppPurchasesCnt;
        this.LoginsLast60min = loginsCount;
    }

    // handy override to see contents
    public override String ToString()
    {
        return $"{this.Datetime},Players Online: {this.OnlinePlayers}, HelpDesk Requests Last 60 Minutes: {this.HelpReqLast60min}, In-app Purchases Last 60 Minutes: {this.InAppPurchasesLast60min}, New Logins Last 60 Minutes: {this.LoginsLast60min}";
    }
}
///
/// helper method to POST simulated data to Power BI API
///
///URL of Power BI REST API
///Array of KPI instances
///TraceWriter instance
static async Task PostSimData(String url, KPI[] kpiArray, TraceWriter log)
{
    HttpResponseMessage response = await client.PostAsJsonAsync (url, kpiArray);
    response.EnsureSuccessStatusCode();
    log.Info($"{NAME} response: {response.ReasonPhrase}");
    return response;
}
///
/// Main entry point for Azure FN
///
///Our timer (unused)
///A logger instance
public static void Run(TimerInfo myTimer, TraceWriter log)
{
    log.Info($"{NAME} Timer trigger function executed at: {DateTime.Now}");
    // extract Power BI REST API endpoint URL from config
    String powerBiApiUrl = System.Environment.GetEnvironmentVariable(APICONFIG, EnvironmentVariableTarget.Process);
    if (String.IsNullOrEmpty(powerBiApiUrl)) {
        throw new WebException($"{APICONFIG} not defined");
    }

    // set up simulated KPI data...
    // these could be database calls, file reads, calculations,
    // or API calls to extract real-time information

    var onlinePlayerCnt = randomGenerator.Next(MIN_PLAYERS, MAX_PLAYERS);
    var helpReqCnt = randomGenerator.Next(MIN_HELPREQ, MAX_HELPREQ);
    var inAppPurchasesCnt = randomGenerator.Next(MIN_PURHCASES, MAX_PURHCASES);
    var loginsCount = randomGenerator.Next(MIN_LOGINS, MAX_LOGINS);

    // populate new KPI object instance
    var kpi = new KPI (onlinePlayerCnt, helpReqCnt, inAppPurchasesCnt, loginsCount);
    KPI[] kpiArray = new[] {kpi};
    var task = PostSimData(powerBiApiUrl, kpiArray, log);
    log.Info(kpi.ToString());
    var json = JsonConvert.SerializeObject(kpiArray);
    log.Info($"JSON request body: {json}");
    log.Info($"{NAME} completed.");
}

