Lakehouse Optimizer for Developers
Optimizing Databricks Workflows with LHO
1.
Ensure LHO is configured to monitor Databricks Workflow Jobs in your dev environment. If it’s not, contact your LHO admin to enable monitoring.
2.
You must set up a Databricks Workflow for your new data process. This involves targeting your development environment with the test job. Setting up your dev environment with a representative initial data set is essential for performance testing. This ensures that when you run the job, it will closely match your production data set, avoiding any discrepancies in the testing process.
If you want to learn methods for generating test datasets, there are several ready-made tools for the job – I’ve had success using Faker. The metadata of your test dataset needs to resemble production data, and you’ll also want to generate a reasonable amount of data. For instance, if the process you’re testing typically handles gigabytes of data, create a test dataset of approximately that size. Faker can rapidly generate the data, and storage is affordable, but having a comparable dataset is crucial.
3.
Kick off your test job. When it’s complete, go to the Workloads section of LHO. You can scroll to your test job or search for it by Job Name or ID.
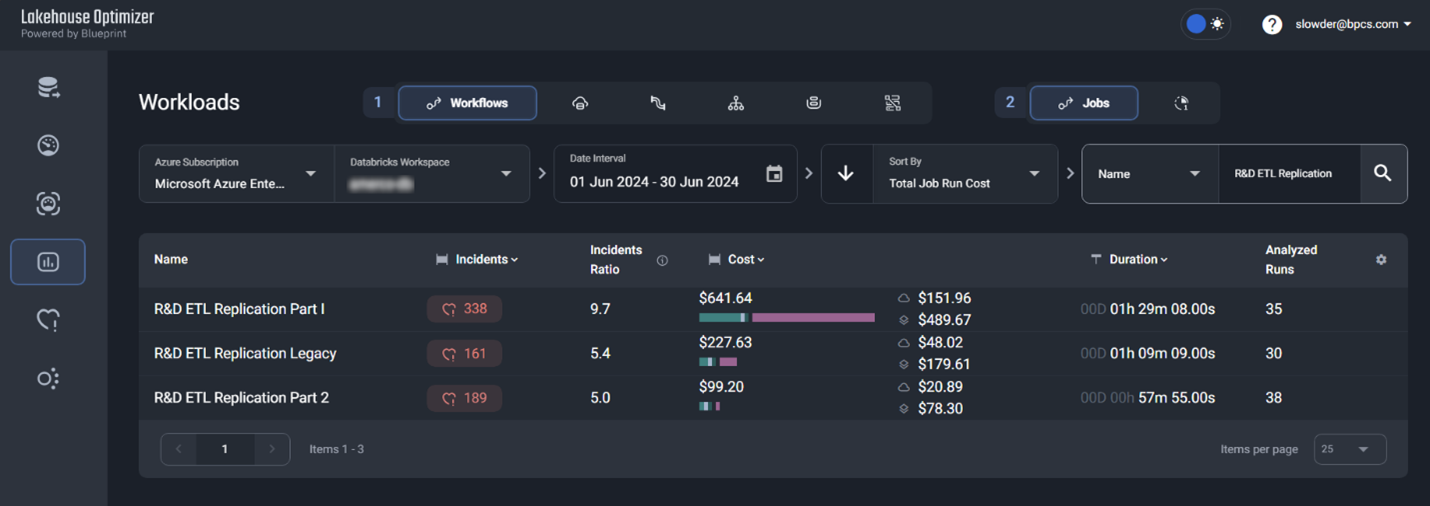
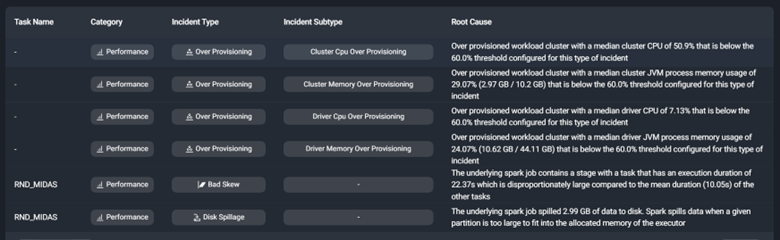
This list details how your code runs on the current cluster. In this case, the driver and workers are over-provisioned. They have more CPU and Memory than they need to perform the work. We could reduce the VM type and number of workers to one with fewer resources. This would mitigate unutilized resources and, thus, lower your Databricks costs.
Click the recommendations button at the top of the incident details to view a list of recommendations for changes.
Reset your dev environment so that it will perform the same workload as before. Then, adjust your cluster configuration and re-run the test. When it’s complete, review the incidents and the new run time. If there are new incidents and the run time is still acceptable, reset the environment and re-run the test. After 2-3 iterations of this review, you’ll have a good idea of the cluster size and configuration that you’ll need to minimize wasteful spending and align your run times with your service level agreements.
Once you’re happy with the optimization, you’re ready for that pull request.
4.
Finally, once the job is deployed to prod, you’ll want to revisit it. For the first few sprints after deployment, I check the job once a sprint to ensure my optimizations are working as intended. I’ll go back to the job details in LHO, but this time, I’ll click on the trend button.
Post-Deployment Review and Cost Optimization
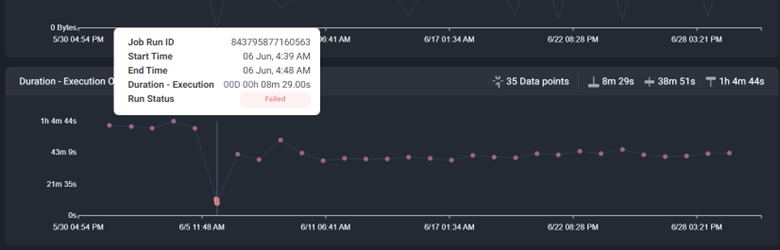
I’ll investigate the details of these failures to determine why they failed. If I can programmatically detect and handle these errors, I’ll improve the code to handle them more gracefully and end the process as soon as possible, minimizing the cost of these failed runs. This will reduce wasteful spending.
Next, I compare the estimated total cost trend against the other charts, like data in, data out, and data processed.
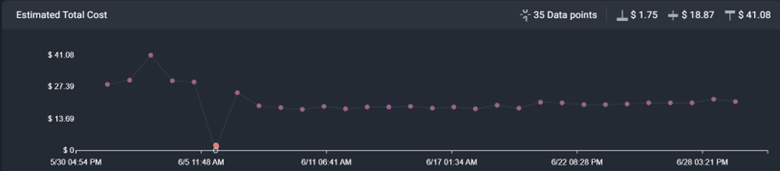
If there is no correlation between data volumes and cost, I’ll want to investigate and understand why. I expect costs to increase when data in, out, or processed increases because data volumes increase over time. If the costs increase without data volume growth, I worry that the code has a flaw. When that happens, I dig deeper into the algorithms implemented in the code andI’ll find a more efficient way to solve the same problem.
Finally, I look at incidents and recommendations again. If there are new recommendations, I’ll consider them. I’ll also make changes to my test data to make it representative of the current state of my data. More data takes longer to process, which can also change how I optimize the cluster for the given job.
While these are extra development steps, this small effort can reduce costs, run times, or both—and it pays for itself quickly!
This is just the beginning of using LHO to optimize your data processing code. In future installments, I look forward to digging into orchestration problems, optimizing incremental data processing, and other common scenarios you can optimize using Blueprint’s data optimization tool!