If you’ve ever wondered how leading retailers like Amazon decide how to locate their distribution centers for quick, efficient, and cost-effective shipping and delivery, read below to learn the best-in-class tools and techniques available to you.
Distribution Center Placement is a Key Business Decision that Impacts Your Bottom Line
When it comes to supply chain management, locating key facilities is crucial to the success and profitability of your operation. Poor placement can result in lost sales, increased lead times, and frequent stock-outs. However, leading players in the e-commerce marketplace, like Amazon, are able to optimize their distribution centers to consistently deliver on logistical miracles like one-day shipping. To achieve this kind of distribution efficiency, the importance of distribution center placement cannot be understated.
If you are a retailer looking to improve your supply chain flow, then you need to be looking at your distribution centers, how many you have, where they’re located, and how to analyze this spatial and quantity data to optimize your speed, efficiency, profitability, and therefore your customer experience. Read below to get in-depth applicable information so you can be armed with the right tools and concepts to strengthen your supply chain management today.
Where to Start: Understanding the Scope of the Ask
In 2022, it’s common for distribution centers to fulfill orders directly to customers while also supplying goods to brick-and-mortar stores. When balancing these two channels, improper placement of distribution centers can impact delivery times, cause late deliveries, and result in lost sales. Secondly, customer experience and revenue can take a hit if products seem available online but are locally inaccessible. However, opening new distribution centers to address gaps in service can be an expensive undertaking with many variable factors and unknowns – which is why it’s key to make informed decisions addressing the three main aspects of this problem: accessibility, affordability, and profitability.
Complicating Factors in the US Market
One of the key complicating factors of addressing the distribution center question in the United States is the size of the country. The US is about 3000 miles in length, with major population centers located on the East and West coasts. To add to the distance issue, cost of real estate can vary immensely – making accessibility and affordability competing variables. How does one manage the cost of shipping cross country while minimizing shipping cost and optimizing distribution center cost?
The good news is that, while this is not a simple problem to solve, it’s a problem that occurs in every industry and can be addressed with a strong numbers based, data science approach.
Solving the Problem: How to Think About Distribution Center Location
To mentally frame the solution, it helps to think of each distribution center as a central location between a cluster of cities. Since we are considering them between cities, the first step is then to identify a cluster of relevant cities.
One method of doing this is to group US cities into regional or population-based clusters, and to then identify the centroid location of each cluster based on the number of stores and cities accessible to each location. In the data science world, this strategy is similar to what is known as a K-means clustering algorithm, so that is the method we will demonstrate as our example solution to this problem.
Addressing Accessibility: In order to address the accessibility question, start by creating a database that contains geographic coordinates (latitude and longitude) alongside populations of the cities. Datasets which pair US cities along with their geographical information and population are publicly available and are therefore a good starting point for generalized solutions, data enrichment and cold-start problems.
Figure 1 provides a glimpse of what the dataset may look like:

Figure 1 USA cities location and population data
Considering Affordability: Look to the affordability index when purchasing real estate property in each city.
The affordability index is based on the percentage of annual income needed to purchase median-priced real estate in each city. The higher the affordability index, the more affordable that metro area is.
With regard to the Affordability index is determined using a proxy metric. This allows our algorithm to assess a corporation’s ability to purchase in a given area. However, although this metric provides a strategic method for assessing estate costs for corporations, it is limited by the fact it does not rely on real-time real estate data. Further, residents’ affordability and a major corporation’s ability to purchase in the area could be loosely related but may not be at parity. These limitations can prevent further action beyond the metric’s strategy assessment, but we are using this example as a potential strategic approach with easily accessible public data
Optimizing Profitability: Typically, with our clients, we would use average revenue from current stores in each city as a primary feature in clustering, along with an ML model to predict revenue in cold-start cities where the client does not yet have a retail location to generate revenue data, but for this post we will use population by each city as a proxy for demonstration purposes – which is also applicable when a distribution center directly fulfills the (online) orders of end customers.
K-means Clustering
K-means clustering is a popular unsupervised machine learning algorithm that partitions data into K distinct clusters. For simplicity, we’ll assume K=5. The algorithm first randomly chooses 5 data points as cluster centroids. Then, it improves the location of the centroids by taking into consideration the Euclidian distance between the centroids and all other points. The 5 points that were calculated to have the minimum average distance from other points will be designated as the new centroids. This process is performed iteratively until the optimal set of centroids are chosen; the iteration at which there are no changes to the centroid set or the defined number of iterations is achieved.
Determining the Optimal Number of Clusters
We arbitrarily chose K=5 clusters in the K-means explanation. However, there are techniques to find K as the optimal number of clusters to use. Here we use the Elbow method and Dendrogram.
Elbow Method
The Elbow method is a heuristic technique to determine the optimal number of clusters in a dataset. This technique uses within-cluster-sum of squared errors (WCSS) for different number of clusters (K) and generates a plot which looks like a curved elbow. From the plot, the K value for which the rate of decrease in WCSS significantly drops forms the “elbow joint” (curved point). This is usually used as the optimal value of K. The elbow-shaped plot of our dataset is shown in Figure 2. According to the figure, K=7 can be a good candidate for the optimal number of clusters since no significant drops in WCSS are seen beyond that value.
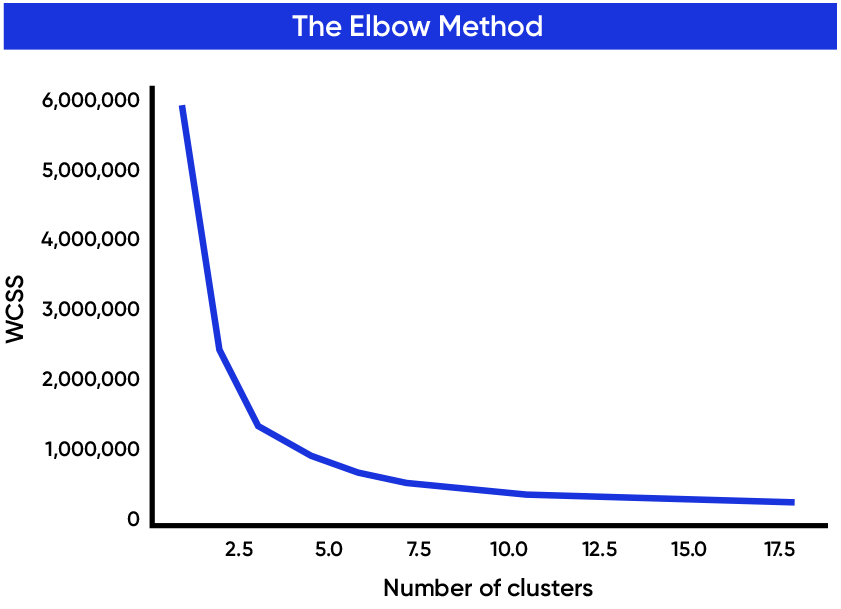
Figure 2 Elbow shape curve from elbow method to determine the optimal number of clusters
Dendrogram
Another method commonly used in cluster analysis is using a cluster tree (dendrogram) which is a hierarchical clustering approach. The dendrogram of the dataset of US cities is shown in Figure 3. The branches (clades) are an indicator of the dissimilarity of data points. The longer clade corresponds to higher dissimilarity of data points.
To find the number of clusters, a horizontal line is drawn across the dendrogram. The line positioning should either intersect with the longest vertical line, or somewhere under the longest vertical line and simultaneously above the very small vertical lines. Our horizontal red line in Figure 3 has 7 intersections with the clades, indicating that using seven clusters is appropriate to partition our dataset. Depending on the desired size of clusters, the red line can be moved up or down.
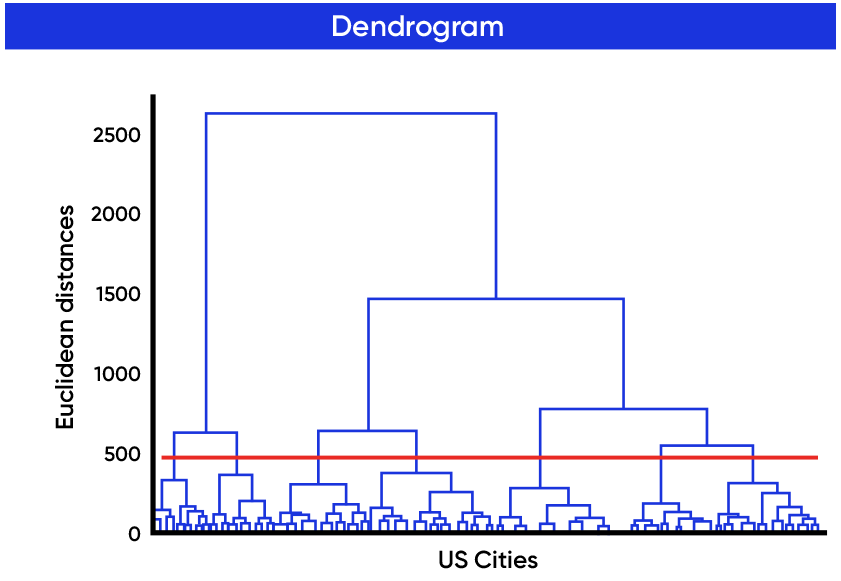
Figure 3 Dendrogram of the US cities: the number of intersections of the red horizontal line with the clades shows the number of clusters
Weighted K-Means Clustering
As discussed earlier, we are solving for the three factors of accessibility, affordability, and profitability. The normal K-means uses Euclidean distance as distance metric to find centroid points which satisfy only the accessibility factor. Since each US city has different levels of affordability and profitability, you need to give higher weights to the cities with better affordability and profitability and lower weights to the cities with lower levels. One way this can be satisfied is by using weighted K-means.
The weighted K-Means technique works in the same way as the normal K-Means. The only difference is that instead of using average Euclidean distance, the weighted average distance would be used to find centroids. The weights we will use here would be the sum of normalized weights for affordability and profitability. The larger the weight of a node (city), the more the centroid will be pulled towards it.
Final Clustering
We want to avoid having a small number of excessively large clusters as this would nurture increased shipping time between facilities. Similarly, we should avoid an excessively large number of smaller clusters as this would foster higher inventory and facility operational costs. Our investigation into the optimal number of clusters to use yielded K=7 clusters. Therefore, we used K=7 and the weights for each city based on their affordability and profitability levels as inputs for the weighted K-means algorithm.
The clusters of the US cities are shown in the latitude and longitude space in Figure 4 and on the US map in Figure 5, along with the location of distribution centers. The distribution center locations should be put in the centroid of each cluster to ensure it is close to the maximum number of cities while they are relatively more affordable with more potential for profitability.
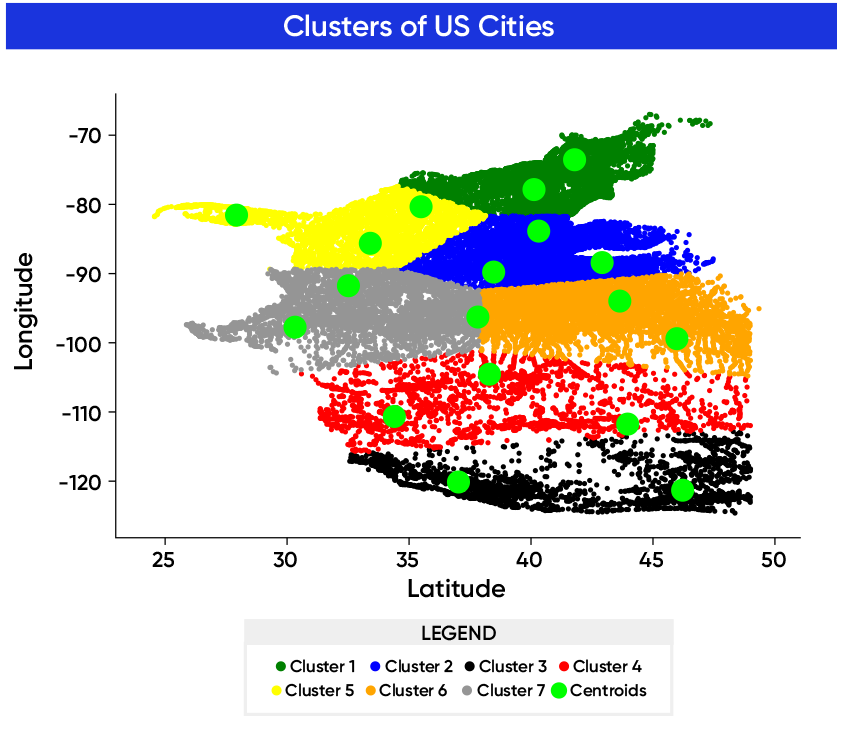
Figure 4 The US cities clusters in latitude and longitude space
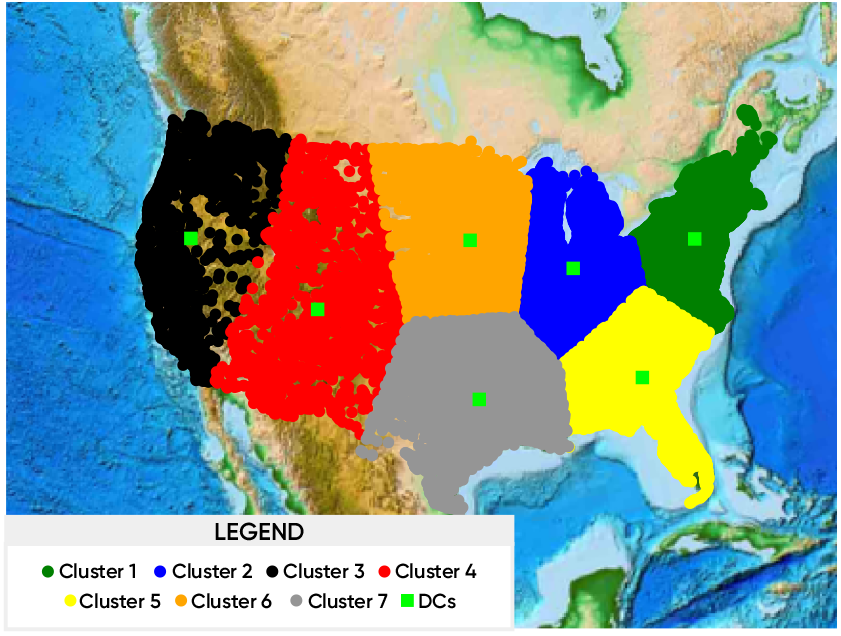
Figure 5 US cities clusters on the map with the optimal location of DCs
Adjusting Clustering Strategy for Various Business Needs
The strategy for locating DCs presented in this article is based on a few assumptions that can be adjusted for when considering various business scenarios and needs. For example, it is often useful to include the data for number, frequency and destination distribution of deliveries in addition to revenue. These additional data features could be incorporated into our weighting scheme as discussed before, or even more directly included in a K-medoids approach with custom distance functions designed around multi-objective optimization goals.
Another scenario could see DCs solely ship goods to stores. In this case, instead of using all the cities as the input to the K-means clustering, it’s more efficient to cluster around store locations. The resulting centroid (DC placement) would then be optimized more for store deliveries.
As an aside to help get you thinking about novel applications of this methodology to your business strategy, let’s look at this analysis applied to the recent Covid-19 pandemic. In the case of an early stage pandemic, we can apply this analysis to help locate optimal testing facilities to reduce the increase rate of new cases. In this scenario, each zip code within the target area is a node and the reported cases and number of residential addresses in each zip code are weights in our k-means algorithm. The areas with higher residential population and higher reported cases have a higher chance of getting a new testing facility.
Applying the Methodology to Business: New Stores Location Recommendation Case Study
In a recent project, we were asked to strategically place 185 stores within the US for a client who was looking to expand their business widely. After clustering the US cities, the most rational way to distribute stores among the cities considered two rules:
- Set the number of stores in each cluster to be proportional to the population of that cluster.
- Within each cluster, keep the distribution of stores proportional to the population of cities in that cluster.
We positioned the stores based on these two rules. The recommended store locations are shown in Figure 6.
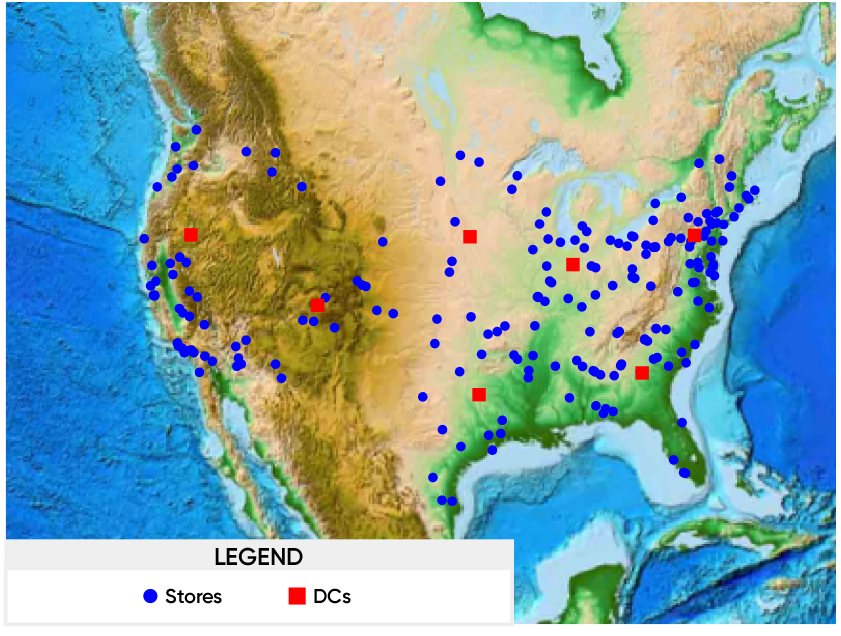
Figure 6 The final location of stores based on the population of cities and their relative location to the distribution centers.
Apply Analytics to Your Own Business Decisions
In this article, we have covered viable techniques for determining the optimal placement of distribution centers and stores for a large retail operation, based on proximity to US cities and their populations. We used weighted K-means clustering to best locate distribution centers, allowing them to efficiently cover shipments within their clusters while remaining affordable and optimizing profitability. The optimal location of stores was suggested as proportional to the population of clusters and cities within each cluster.
When working with clients, the techniques and data used here are not used in isolation, but in conjunction with other critical considerations like revenue, demand, market opportunity, real estate availability and cost, drive time estimates, and any strategic objectives relevant to the business.
However, the strategies demonstrated in this article can be applied to any industry—especially ones that deal with high distribution activities—and can be customized based on individual and specific business needs to increase the efficiency and profitability of your business.
If you’re interested in what these strategies and techniques can do for your business, but not sure where to start, read up on these other articles:
If you’ve decided you want to move forward and apply these strategies, reach out to us!

